Tag Archives: security

systemd Hardening for Long-Running Daemons

A long-running daemon that talks to the network and a database is the thing an attacker wants most, and it is usually the thing running with the fewest restrictions. systemd ships a large set of sandboxing directives that cost nothing at runtime and are almost never used, mostly because the documentation presents forty options with no indication of which ones matter.

Measure First

systemd will grade the unit for you, which is a better starting point than reading the manual page end to end:

systemd-analyze security tracker.service

You get a per-directive table and an overall exposure score from 0 to 10. A default unit with no hardening scores around 9.6, which the tool cheerfully labels UNSAFE. The score is a rough heuristic rather than a real measure of risk, and it is genuinely useful for ordering the work, since it sorts by exposure and shows what each setting would buy.

The Directives Worth Setting

These are the ones I put on every service, in rough order of value per unit of trouble:

[Service]
NoNewPrivileges=yes
PrivateTmp=yes
ProtectSystem=strict
ProtectHome=yes
ProtectKernelTunables=yes
ProtectKernelModules=yes
ProtectKernelLogs=yes
ProtectControlGroups=yes
ProtectClock=yes
ProtectHostname=yes
ProtectProc=invisible
RestrictNamespaces=yes
RestrictRealtime=yes
RestrictSUIDSGID=yes
LockPersonality=yes
RemoveIPC=yes
MemoryDenyWriteExecute=yes
SystemCallArchitectures=native
SystemCallFilter=@system-service
CapabilityBoundingSet=
RestrictAddressFamilies=AF_INET AF_INET6 AF_UNIX

NoNewPrivileges=yes is the single highest-value line. It blocks setuid escalation for the process and everything it spawns, and almost nothing legitimately needs the alternative.

ProtectSystem=strict mounts the entire filesystem read-only apart from /dev, /proc, and /sys. Combined with ProtectHome=yes, a compromised process cannot write anywhere at all until you grant specific paths back:

ReadWritePaths=/var/lib/tracker /var/log/tracker
RuntimeDirectory=tracker
StateDirectory=tracker

The RuntimeDirectory and StateDirectory forms are better than listing paths by hand, because systemd creates them with the right ownership and cleans up runtime state on stop.

CapabilityBoundingSet= with an empty value drops every capability. Most daemons need none, and the common exception is binding a port below 1024, which needs CAP_NET_BIND_SERVICE added back. Better still, use a socket unit and let systemd hold the privileged socket so the service never needs the capability at all.

RestrictAddressFamilies is worth the thought. A daemon doing DNS and PostgreSQL over TCP needs AF_INET, AF_INET6, and AF_UNIX for the local socket. It has no business creating a raw packet socket or an AF_NETLINK socket, and denying those closes a real avenue.

The Ones That Will Break You

MemoryDenyWriteExecute=yes blocks pages that are both writable and executable. It is excellent against a large class of exploit, and it breaks anything with a JIT. For a C++ daemon it is usually free. For anything embedding a scripting runtime, test carefully.

SystemCallFilter=@system-service is the setting most likely to produce a mysterious failure. The allow list covers what normal services do, and a program using something unusual gets killed with SIGSYS and no useful message. When a service dies immediately after adding it, find the offending call rather than guessing:

journalctl -u tracker.service | grep -i seccomp
auditctl -a always,exit -F arch=b64 -S all -F key=seccomp-debug

ProtectSystem=strict breaks anything writing outside its declared paths, which in practice means log files in unexpected places and PID files in /var/run. Both are better fixed than exempted.

ProtectProc=invisible hides other users’ processes in /proc. Harmless for most daemons and immediately fatal for anything that inspects the process table, including some monitoring agents.

Do It Incrementally

Adding all twenty lines at once and finding the service dead tells you nothing about which line did it. Add the block above minus SystemCallFilter and MemoryDenyWriteExecute, confirm the service still works under real load rather than just starting, then add those two separately.

“Starts successfully” is a weak test. Sandboxing failures show up on code paths that only run occasionally, so the syscall your daemon makes once a day during log rotation is exactly the one the filter blocks. Give a hardened unit a full cycle of whatever periodic work it does before considering it verified.

None of this replaces running as an unprivileged user, keeping the software patched, or putting the database somewhere the internet cannot reach. It is the layer underneath those, and it is roughly twenty lines of configuration that turns a total compromise of the process into a considerably less useful foothold.
Generator Labs Nagios and Zabbix Plugins for Blacklist and Certificate Monitoring

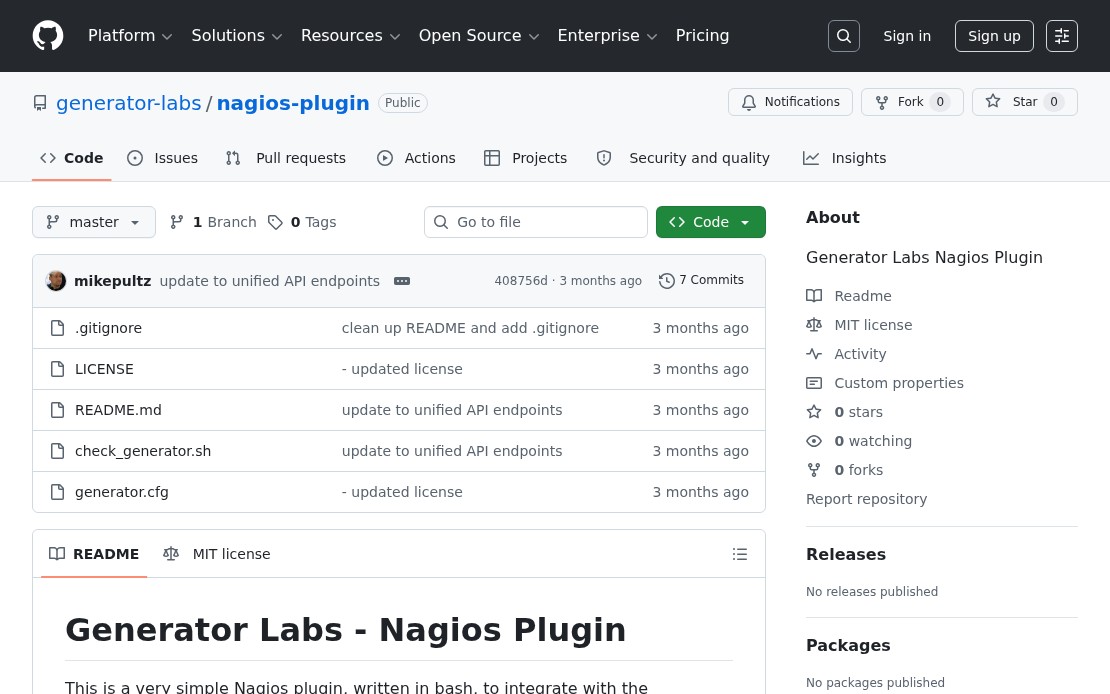
Generator Labs Nagios plugin GitHub repository

If you run Nagios or Zabbix, Generator Labs monitoring data can now flow directly into your existing infrastructure monitoring stack. Updated plugins for both platforms are available on GitHub, adding support for certificate monitoring alongside the existing blacklist monitoring checks.

Nagios Plugin

The Nagios plugin is a bash script that calls the Generator Labs API and maps the response to standard Nagios exit codes:

  • OK when no issues are detected
  • CRITICAL when active listings or certificate errors are found
  • UNKNOWN on API or configuration errors

Two check types are supported:

  • rbl: checks for active blacklist listings on a host
  • cert: checks for active certificate errors on a monitor

Install by copying check_generator.sh to your Nagios plugins directory and adding the command and service definitions. A complete example configuration is included in the repository.

Zabbix Plugin

The Zabbix plugin uses the same API and exposes the same check types as Zabbix external checks. Import the provided template, set your Account SID and API token as macros, and hosts are automatically discovered and mapped to Zabbix items and triggers.

Both plugins replace the legacy RBLTracker plugins. If you were running the old versions, remove them and install the updated ones. The check syntax is unchanged, so existing service definitions don’t need to be updated.

Documentation

Query Your Generator Labs Monitoring Data from Any AI Assistant

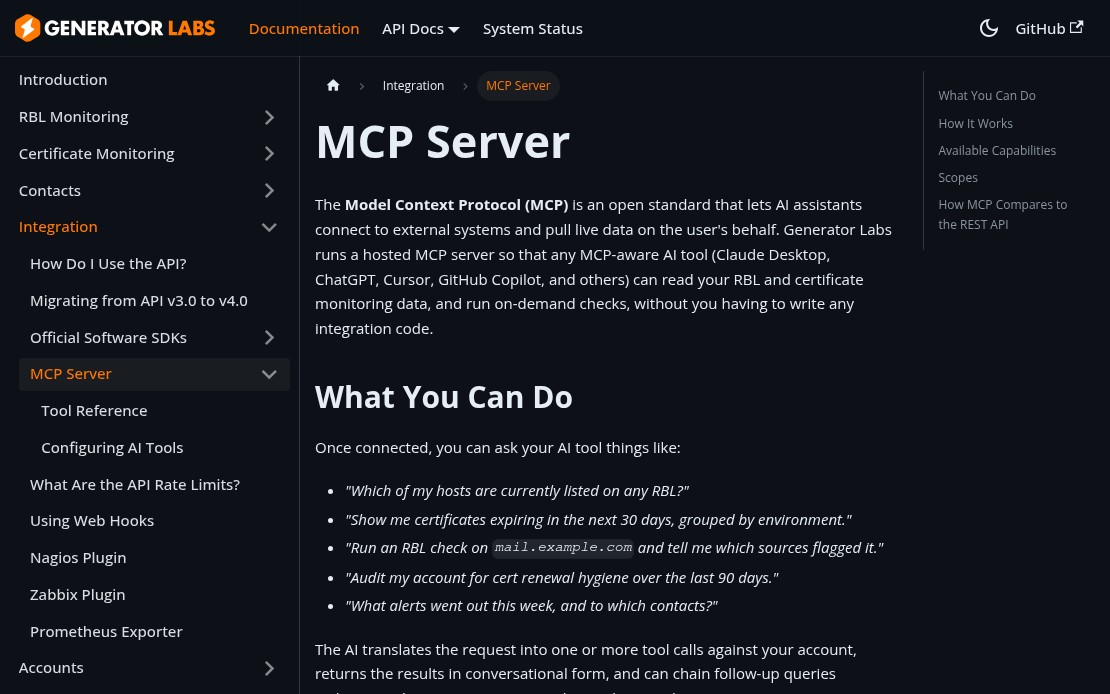
Generator Labs MCP server documentation page

Generator Labs now runs a hosted MCP (Model Context Protocol) server, which means any MCP-aware AI tool can read your monitoring data and run on-demand checks directly from the chat interface. No switching tabs, no copying host names, no manual lookups.

What You Can Ask

Once connected, your AI assistant has access to your full account data and can answer questions like:

  • “Which of my hosts are currently listed on any RBL?”
  • “Show me certificates expiring in the next 30 days.”
  • “Run a check on mail.example.com and tell me what flagged it.”
  • “What alerts went out this week, and to which contacts?”

The AI translates your request into tool calls, returns results in plain language, and can chain follow-up queries without leaving the conversation.

Supported Tools

Area What’s Available
Blacklist Monitoring List and inspect hosts, active listings, profiles, check history, run manual checks
Certificate Monitoring List monitors, view expiring certs, inspect errors, run compliance audits
Notifications View contacts, groups, webhooks, and recent alerts
Account Summary, balance, and server health

Connecting

The MCP endpoint is at https://api.generatorlabs.com/4.0/mcp. For Claude Desktop, add this to your claude_desktop_config.json:

{
  "mcpServers": {
    "generator-labs": {
      "type": "http",
      "url": "https://api.generatorlabs.com/4.0/mcp",
      "headers": {
        "Authorization": "Basic <base64 of AccountSID:AuthToken>"
      }
    }
  }
}

For Claude.ai, ChatGPT, and other tools that support OAuth 2.1, add a custom connector with the endpoint URL and complete the browser-based auth flow.

Full setup instructions are in the MCP documentation.

Monitor Your Email Reputation and Certificates in Prometheus

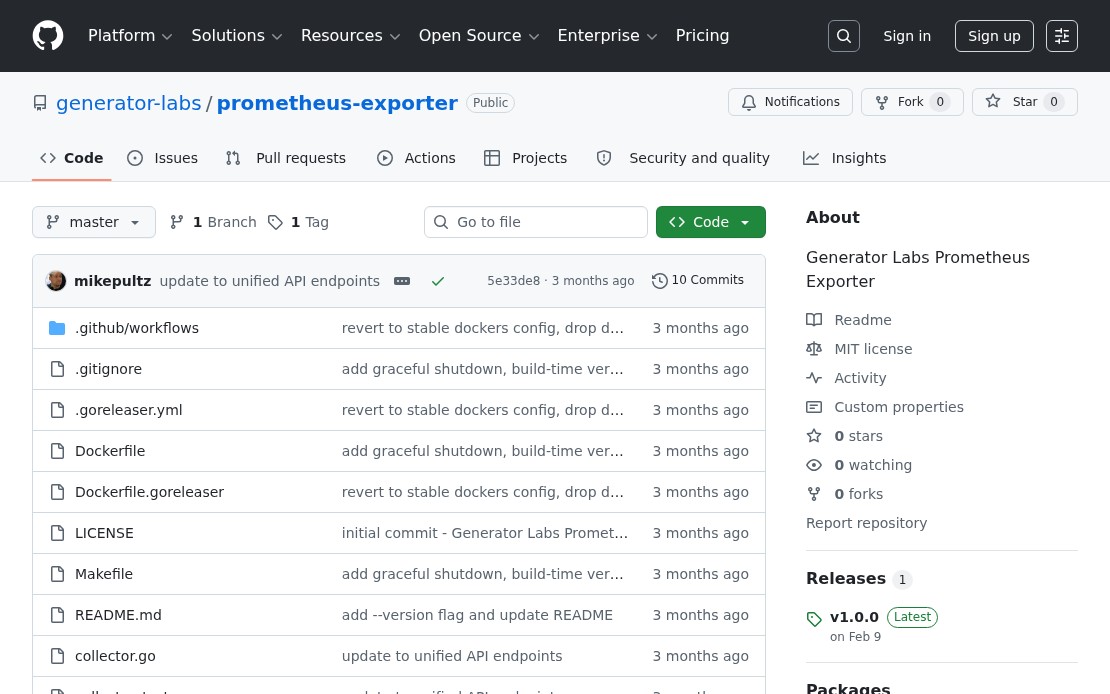
Generator Labs Prometheus exporter GitHub repository

If your team already runs Prometheus, you can now pull Generator Labs monitoring data directly into your metrics stack. The Generator Labs Prometheus exporter exposes blacklist listing status and SSL certificate expiry as standard Prometheus metrics, making it straightforward to build Grafana dashboards or set up alerting rules alongside the rest of your infrastructure.

What It Exports

The exporter surfaces metrics for both products:

  • Blacklist monitoring: active listing status per host, listing counts by source type, last check timestamps
  • Certificate monitoring: days until expiration per monitor, active error status, chain and hostname validation results

These map cleanly to Grafana panels: a certificate expiry countdown per domain, a listing status heatmap across your host inventory, or a single alert rule that fires when any host gets listed or any cert drops below 14 days.

Installation

Three options are available depending on your environment:

Pre-built binary: download from the GitHub releases page and run directly. No dependencies.

Docker:

docker run -e GENERATOR_LABS_ACCOUNT_SID=your_sid \
           -e GENERATOR_LABS_AUTH_TOKEN=your_token \
           -p 9090:9090 \
           ghcr.io/generator-labs/prometheus-exporter:latest

Build from source: requires Go 1.21 or later.

Configuration

The exporter takes two credentials: your Account SID and API token from your Generator Labs account settings. Supply them as flags (--account-sid, --auth-token) or the environment variables above. The metrics endpoint is exposed on port 9090 by default.

Add a scrape config to your prometheus.yml:

scrape_configs:
  - job_name: 'generator-labs'
    static_configs:
      - targets: ['localhost:9090']

Full setup guide on GitHub.

Monitoring Your Email Reputation with Microsoft Smart Network Data Services

Standard blacklist monitoring tells you whether your sending IPs appear on public RBLs. It doesn’t tell you how Microsoft specifically views your mail. That’s a separate reputation system, and it matters a lot: Outlook.com, Hotmail, and MSN together represent a significant share of consumer email. Generator Labs now integrates directly with Microsoft Smart Network Data Services (SNDS) inside your blacklist monitoring dashboard.

What SNDS Provides

SNDS is a free Microsoft program that gives senders data about mail flowing from their IP addresses into Microsoft’s mail infrastructure. The metrics it returns include:

  • Message volume from each IP
  • Spam complaint rate
  • Spam trap hits
  • Overall IP status (Green / Yellow / Red)
  • Filter result breakdown

A Red status from SNDS means Microsoft is actively blocking or heavily filtering mail from that IP. Yellow is a warning that reputation is declining. Most teams only discover this when customers start reporting missing mail.

Why It’s Worth Monitoring Separately

SNDS status doesn’t always correlate with your RBL status. You can be clean on every public blocklist and still have a Yellow or Red SNDS rating because of complaint rates, trap hits, or sending patterns that Microsoft’s filters flag specifically. The inverse is also true: an SNDS Green rating doesn’t mean you’re clean on all public RBLs.

Treating SNDS as a separate signal, alongside your regular blacklist monitoring, gives you a more complete picture of your sending reputation and catches Microsoft-specific issues before they escalate.

Setup

Go to RBL Monitoring > SNDS in the portal and add your SNDS access key. Microsoft issues one key per registered IP range. Once connected, Generator Labs pulls your SNDS data automatically and surfaces status changes alongside your other monitoring results.

Setup instructions are in the SNDS documentation.