If you run Nagios or Zabbix, Generator Labs monitoring data can now flow directly into your existing infrastructure monitoring stack. Updated plugins for both platforms are available on GitHub, adding support for certificate monitoring alongside the existing blacklist monitoring checks.
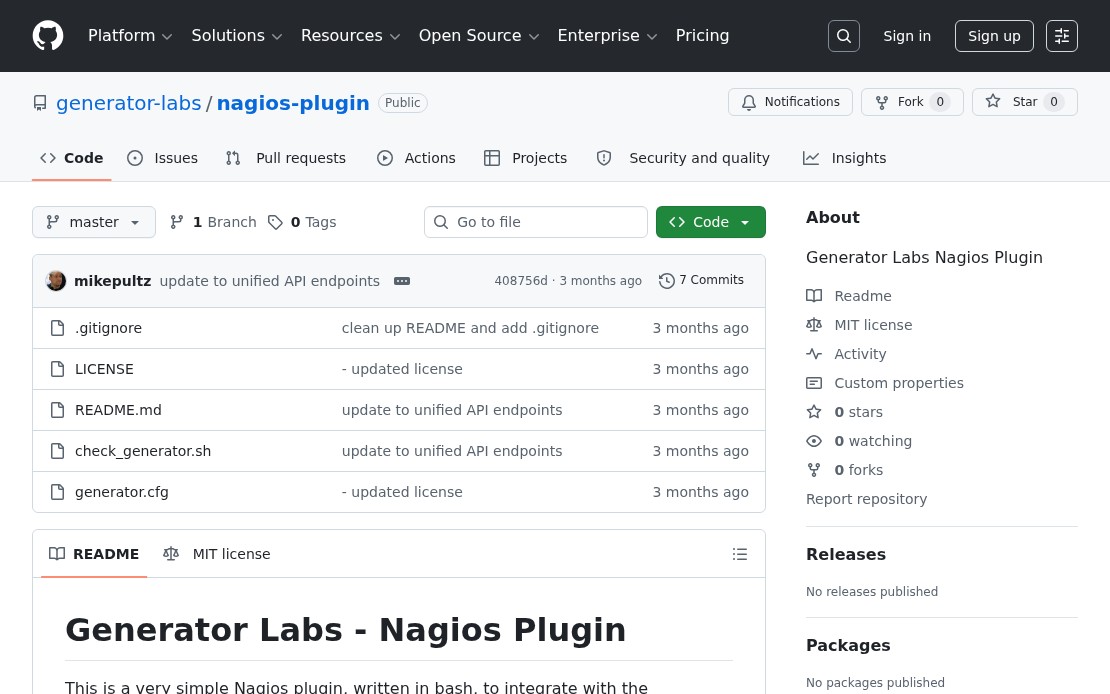
Nagios Plugin
The Nagios plugin is a bash script that calls the Generator Labs API and maps the response to standard Nagios exit codes:
- OK when no issues are detected
- CRITICAL when active listings or certificate errors are found
- UNKNOWN on API or configuration errors
Two check types are supported:
rbl: checks for active blacklist listings on a hostcert: checks for active certificate errors on a monitor
Install by copying check_generator.sh to your Nagios plugins directory and adding the command and service definitions. A complete example configuration is included in the repository.
Zabbix Plugin
The Zabbix plugin uses the same API and exposes the same check types as Zabbix external checks. Import the provided template, set your Account SID and API token as macros, and hosts are automatically discovered and mapped to Zabbix items and triggers.
Both plugins replace the legacy RBLTracker plugins. If you were running the old versions, remove them and install the updated ones. The check syntax is unchanged, so existing service definitions don’t need to be updated.