Tag Archives: certificate monitoring

Generator Labs Nagios and Zabbix Plugins for Blacklist and Certificate Monitoring

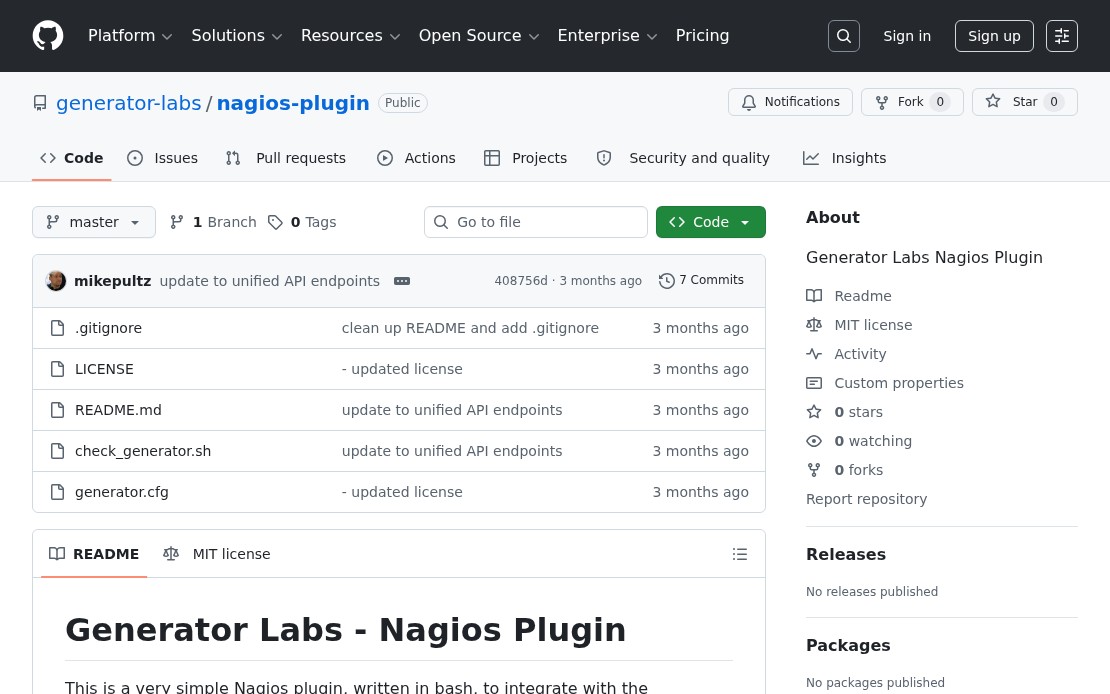
Generator Labs Nagios plugin GitHub repository

If you run Nagios or Zabbix, Generator Labs monitoring data can now flow directly into your existing infrastructure monitoring stack. Updated plugins for both platforms are available on GitHub, adding support for certificate monitoring alongside the existing blacklist monitoring checks.

Nagios Plugin

The Nagios plugin is a bash script that calls the Generator Labs API and maps the response to standard Nagios exit codes:

  • OK when no issues are detected
  • CRITICAL when active listings or certificate errors are found
  • UNKNOWN on API or configuration errors

Two check types are supported:

  • rbl: checks for active blacklist listings on a host
  • cert: checks for active certificate errors on a monitor

Install by copying check_generator.sh to your Nagios plugins directory and adding the command and service definitions. A complete example configuration is included in the repository.

Zabbix Plugin

The Zabbix plugin uses the same API and exposes the same check types as Zabbix external checks. Import the provided template, set your Account SID and API token as macros, and hosts are automatically discovered and mapped to Zabbix items and triggers.

Both plugins replace the legacy RBLTracker plugins. If you were running the old versions, remove them and install the updated ones. The check syntax is unchanged, so existing service definitions don’t need to be updated.
Documentation

Query Your Generator Labs Monitoring Data from Any AI Assistant

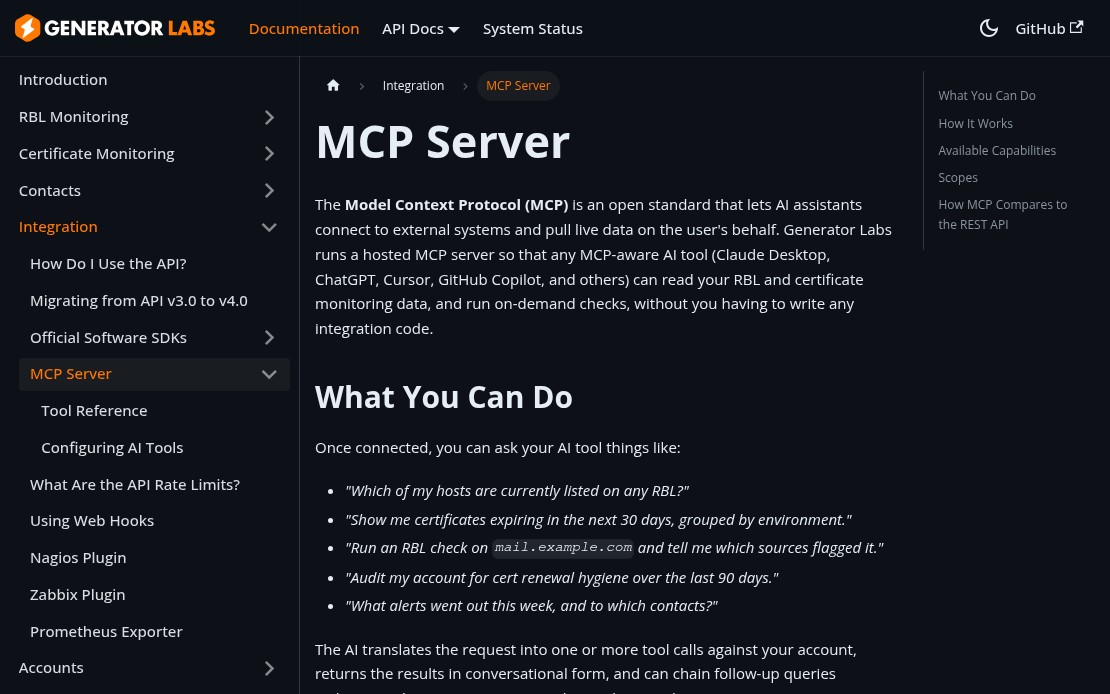
Generator Labs MCP server documentation page

Generator Labs now runs a hosted MCP (Model Context Protocol) server, which means any MCP-aware AI tool can read your monitoring data and run on-demand checks directly from the chat interface. No switching tabs, no copying host names, no manual lookups.

What You Can Ask

Once connected, your AI assistant has access to your full account data and can answer questions like:

  • “Which of my hosts are currently listed on any RBL?”
  • “Show me certificates expiring in the next 30 days.”
  • “Run a check on mail.example.com and tell me what flagged it.”
  • “What alerts went out this week, and to which contacts?”

The AI translates your request into tool calls, returns results in plain language, and can chain follow-up queries without leaving the conversation.

Supported Tools

Area What’s Available
Blacklist Monitoring List and inspect hosts, active listings, profiles, check history, run manual checks
Certificate Monitoring List monitors, view expiring certs, inspect errors, run compliance audits
Notifications View contacts, groups, webhooks, and recent alerts
Account Summary, balance, and server health

Connecting

The MCP endpoint is at https://api.generatorlabs.com/4.0/mcp. For Claude Desktop, add this to your claude_desktop_config.json:

{
  "mcpServers": {
    "generator-labs": {
      "type": "http",
      "url": "https://api.generatorlabs.com/4.0/mcp",
      "headers": {
        "Authorization": "Basic <base64 of AccountSID:AuthToken>"
      }
    }
  }
}

For Claude.ai, ChatGPT, and other tools that support OAuth 2.1, add a custom connector with the endpoint URL and complete the browser-based auth flow.

Full setup instructions are in the MCP documentation.

Monitor Your Email Reputation and Certificates in Prometheus

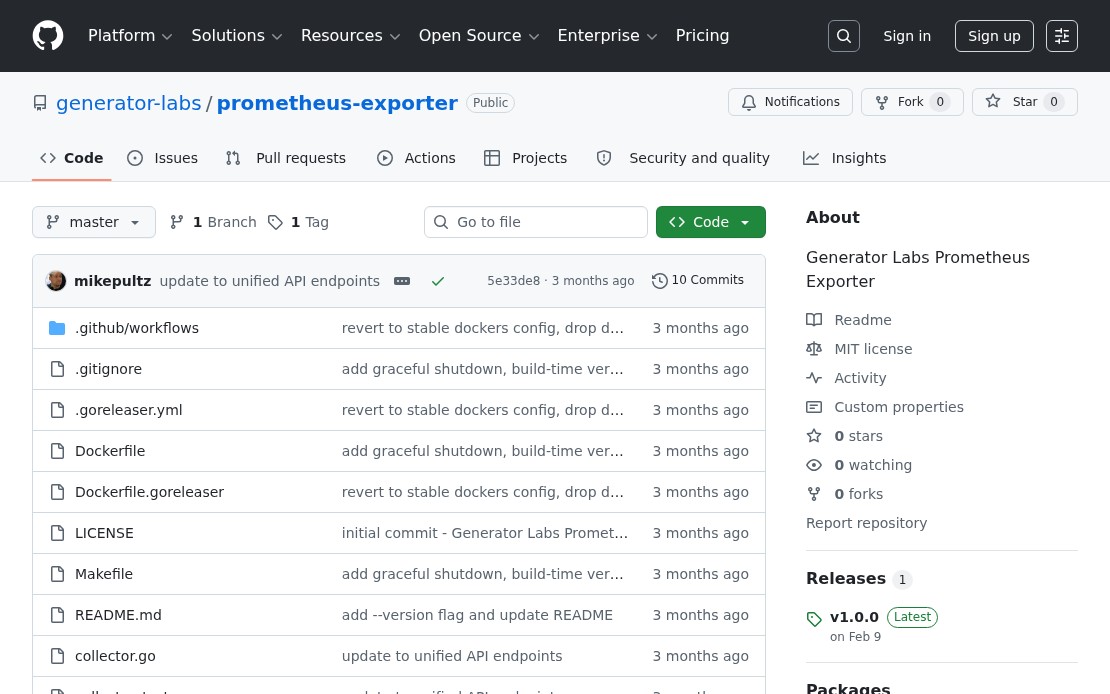
Generator Labs Prometheus exporter GitHub repository

If your team already runs Prometheus, you can now pull Generator Labs monitoring data directly into your metrics stack. The Generator Labs Prometheus exporter exposes blacklist listing status and SSL certificate expiry as standard Prometheus metrics, making it straightforward to build Grafana dashboards or set up alerting rules alongside the rest of your infrastructure.

What It Exports

The exporter surfaces metrics for both products:

  • Blacklist monitoring: active listing status per host, listing counts by source type, last check timestamps
  • Certificate monitoring: days until expiration per monitor, active error status, chain and hostname validation results

These map cleanly to Grafana panels: a certificate expiry countdown per domain, a listing status heatmap across your host inventory, or a single alert rule that fires when any host gets listed or any cert drops below 14 days.

Installation

Three options are available depending on your environment:

Pre-built binary: download from the GitHub releases page and run directly. No dependencies.

Docker:

docker run -e GENERATOR_LABS_ACCOUNT_SID=your_sid \
           -e GENERATOR_LABS_AUTH_TOKEN=your_token \
           -p 9090:9090 \
           ghcr.io/generator-labs/prometheus-exporter:latest

Build from source: requires Go 1.21 or later.

Configuration

The exporter takes two credentials: your Account SID and API token from your Generator Labs account settings. Supply them as flags (--account-sid, --auth-token) or the environment variables above. The metrics endpoint is exposed on port 9090 by default.

Add a scrape config to your prometheus.yml:

scrape_configs:
  - job_name: 'generator-labs'
    static_configs:
      - targets: ['localhost:9090']

Full setup guide on GitHub.

SSL Certificate Monitoring That Goes Beyond Expiration Dates

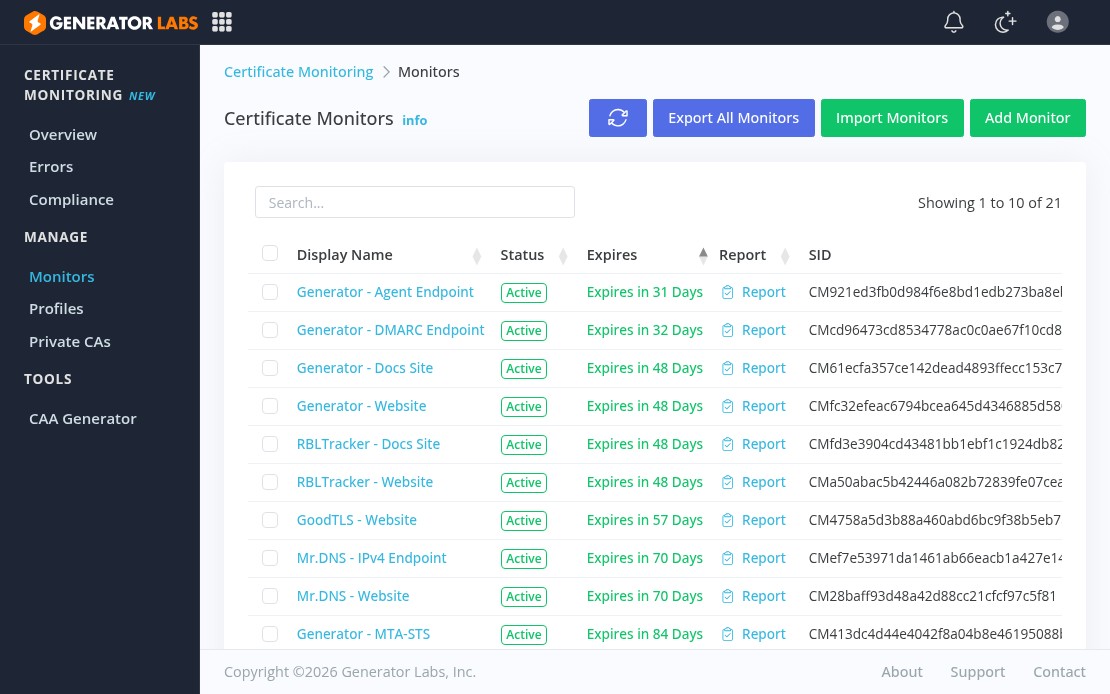
Generator Labs certificate monitoring portal showing active monitors

Most certificate monitoring tools do one thing: alert you when a certificate is about to expire. That’s useful, but expiration is only one of the ways a certificate can fail. Generator Labs certificate monitoring runs eight independently configurable checks on every scan, so you catch problems that a basic expiry check misses entirely.

What Gets Checked on Every Scan

Each monitoring profile supports up to eight alert types:

  • Expiration: configurable thresholds anywhere from 0 to 90 days out, up to 10 per profile
  • Chain integrity: catches missing or expired intermediate certificates before clients do
  • Hostname mismatch: flags certificates that don’t cover the host they’re serving
  • CA trust failure: alerts when a certificate can’t be validated to a trusted root
  • Revocation: detects certificates that have been pulled by their issuing CA
  • Fingerprint changes: tracks renewals and unexpected replacements
  • Certificate flapping: multiple fingerprint changes in a short window, often a load balancer misconfiguration
  • Missing or misconfigured CAA records: ensures only authorized CAs can issue for your domains

All eight can be toggled independently per profile, so you can be aggressive on production hosts and quieter on staging or internal infrastructure.

Monitoring Profiles

Profiles group hosts with shared settings. A common pattern is a Production profile with tight thresholds and PagerDuty alerts, a Staging profile with looser thresholds and email-only, and a separate Internal profile for private CA hosts. Profile changes apply immediately across all assigned hosts.

Internal and Private Certificate Monitoring

External checks can’t reach internal services, self-signed certificates, or private CA infrastructure. The private certificate monitoring agent is a lightweight Docker container you deploy inside your network. It checks internal hosts and reports back to the platform over outbound HTTPS. No inbound firewall rules needed, and private keys never leave your network.

Protocol Coverage

The monitor handles direct TLS on any port, plus STARTTLS for SMTP, IMAP, POP3, LMTP, FTP, and LDAP, and the implicit TLS variants: SMTPS, IMAPS, POP3S, FTPS, LDAPS. If TLS is running on it, you can monitor it.

Pricing

Certificate monitoring is $0.01 per host per day. No contracts, no minimums, no flat fees. You pay for active hosts only. Full details on the certificate monitoring pricing page.

Monitoring Internal and Private CA Certificates with Generator Labs

External certificate monitoring works well for public-facing infrastructure, but it has an obvious blind spot: it can’t reach anything inside your private network. Internal APIs, databases with TLS-encrypted connections, mail servers on non-public ports, self-signed certificates, and infrastructure issued by a private CA all go completely unmonitored. Those certificates still expire. When they do, the failures tend to be worse, because internal services rarely have the same visibility as public ones.

Generator Labs internal certificate monitoring solves this with a lightweight on-premise agent you deploy as a Docker container inside your network.

How It Works

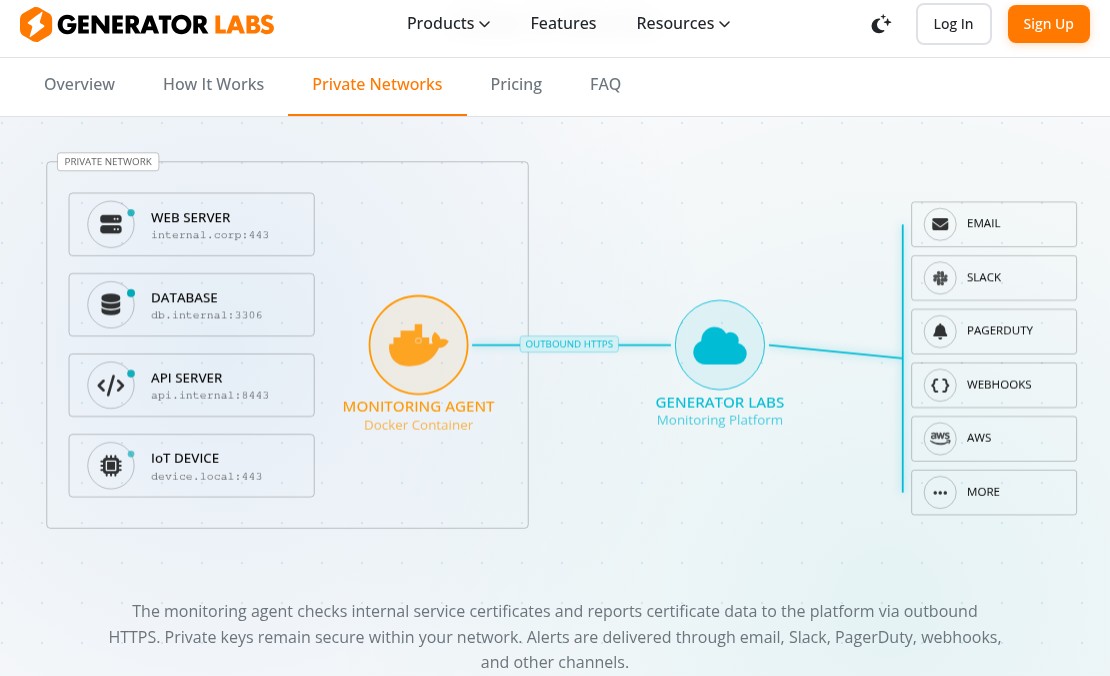
Diagram showing the Generator Labs private monitoring agent connecting internal hosts to the platform over outbound HTTPS

The agent runs inside your private network, connects to your internal hosts, retrieves their certificates, and reports the data back to the Generator Labs platform over outbound HTTPS. No inbound firewall rules are required. Private keys never leave your network. From the platform’s side, internal monitors look and behave exactly like external ones.

What It Can Monitor

The agent connects to any TLS endpoint your network can reach:

  • Internal web servers and APIs
  • Databases with TLS connections (PostgreSQL, MySQL, MongoDB, Redis)
  • Internal mail servers (SMTP, IMAP, POP3 with STARTTLS or implicit TLS)
  • IoT devices and embedded systems serving TLS on custom ports
  • Any service running TLS on any port

It runs the same eight checks as external monitoring: expiration, chain integrity, hostname validation, CA trust, revocation, fingerprint changes, flapping, and CAA records.

Private CA Support

If your internal certificates are issued by a private CA, you can import that CA’s root certificate into the platform. The agent then validates certificate chains all the way to your private root, so chain integrity checks work correctly for internally-issued certificates, not just publicly-trusted ones.

Alerts

All the same notification channels are available: email, Slack, PagerDuty, Discord, webhooks, AWS SNS, and more. Internal certificate expiration or chain failures trigger the same alert pipeline as any other monitoring event.

Getting Started

The agent is open source and available at github.com/generator-labs/agent. Deploying it takes a few minutes: pull the Docker image, set your API credentials as environment variables, and configure the hosts you want to monitor. Full setup instructions are on the internal certificate monitoring page.