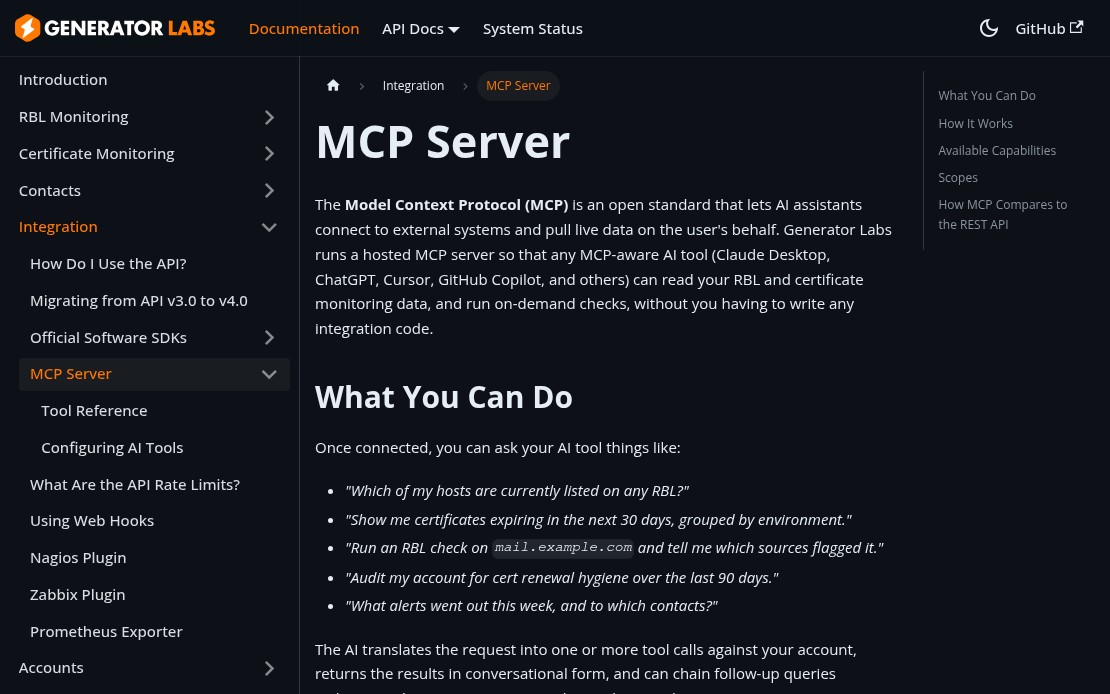
Generator Labs now runs a hosted MCP (Model Context Protocol) server, which means any MCP-aware AI tool can read your monitoring data and run on-demand checks directly from the chat interface. No switching tabs, no copying host names, no manual lookups.
What You Can Ask
Once connected, your AI assistant has access to your full account data and can answer questions like:
“Which of my hosts are currently listed on any RBL?”
“Show me certificates expiring in the next 30 days.”
“Run a check on mail.example.com and tell me what flagged it.”
“What alerts went out this week, and to which contacts?”
The AI translates your request into tool calls, returns results in plain language, and can chain follow-up queries without leaving the conversation.
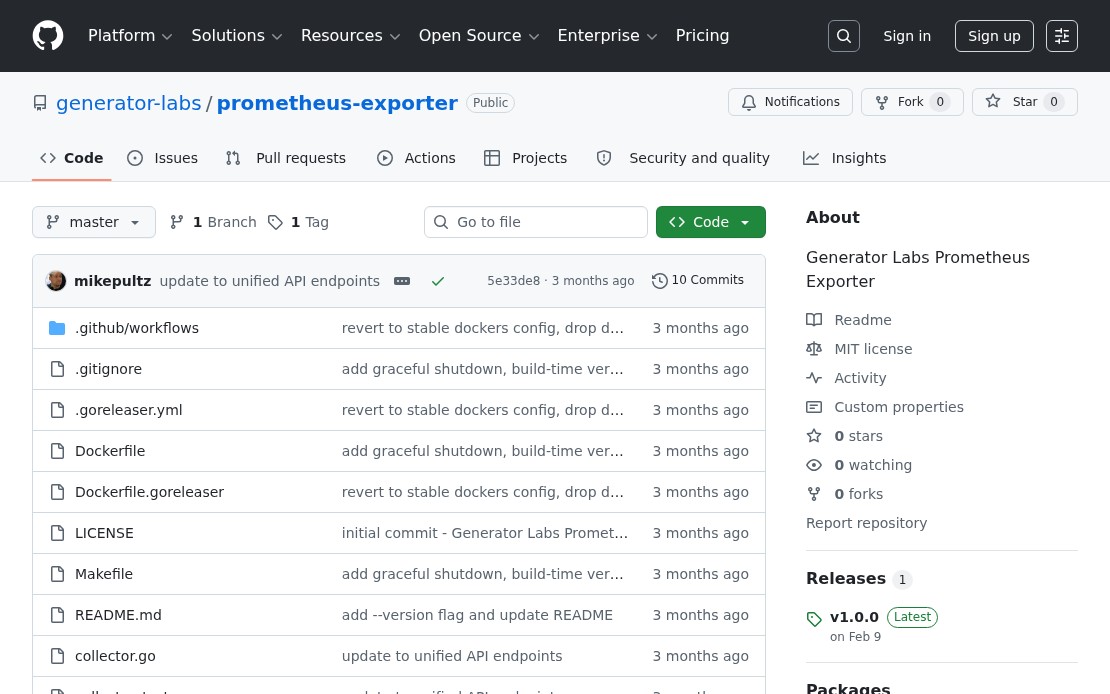
If your team already runs Prometheus, you can now pull Generator Labs monitoring data directly into your metrics stack. The Generator Labs Prometheus exporter exposes blacklist listing status and SSL certificate expiry as standard Prometheus metrics, making it straightforward to build Grafana dashboards or set up alerting rules alongside the rest of your infrastructure.
What It Exports
The exporter surfaces metrics for both products:
Blacklist monitoring: active listing status per host, listing counts by source type, last check timestamps
Certificate monitoring: days until expiration per monitor, active error status, chain and hostname validation results
These map cleanly to Grafana panels: a certificate expiry countdown per domain, a listing status heatmap across your host inventory, or a single alert rule that fires when any host gets listed or any cert drops below 14 days.
Installation
Three options are available depending on your environment:
Pre-built binary: download from the GitHub releases page and run directly. No dependencies.
The exporter takes two credentials: your Account SID and API token from your Generator Labs account settings. Supply them as flags (--account-sid, --auth-token) or the environment variables above. The metrics endpoint is exposed on port 9090 by default.
Standard blacklist monitoring tells you whether your sending IPs appear on public RBLs. It doesn’t tell you how Microsoft specifically views your mail. That’s a separate reputation system, and it matters a lot: Outlook.com, Hotmail, and MSN together represent a significant share of consumer email. Generator Labs now integrates directly with Microsoft Smart Network Data Services (SNDS) inside your blacklist monitoring dashboard.
What SNDS Provides
SNDS is a free Microsoft program that gives senders data about mail flowing from their IP addresses into Microsoft’s mail infrastructure. The metrics it returns include:
Message volume from each IP
Spam complaint rate
Spam trap hits
Overall IP status (Green / Yellow / Red)
Filter result breakdown
A Red status from SNDS means Microsoft is actively blocking or heavily filtering mail from that IP. Yellow is a warning that reputation is declining. Most teams only discover this when customers start reporting missing mail.
Why It’s Worth Monitoring Separately
SNDS status doesn’t always correlate with your RBL status. You can be clean on every public blocklist and still have a Yellow or Red SNDS rating because of complaint rates, trap hits, or sending patterns that Microsoft’s filters flag specifically. The inverse is also true: an SNDS Green rating doesn’t mean you’re clean on all public RBLs.
Treating SNDS as a separate signal, alongside your regular blacklist monitoring, gives you a more complete picture of your sending reputation and catches Microsoft-specific issues before they escalate.
Setup
Go to RBL Monitoring > SNDS in the portal and add your SNDS access key. Microsoft issues one key per registered IP range. Once connected, Generator Labs pulls your SNDS data automatically and surfaces status changes alongside your other monitoring results.
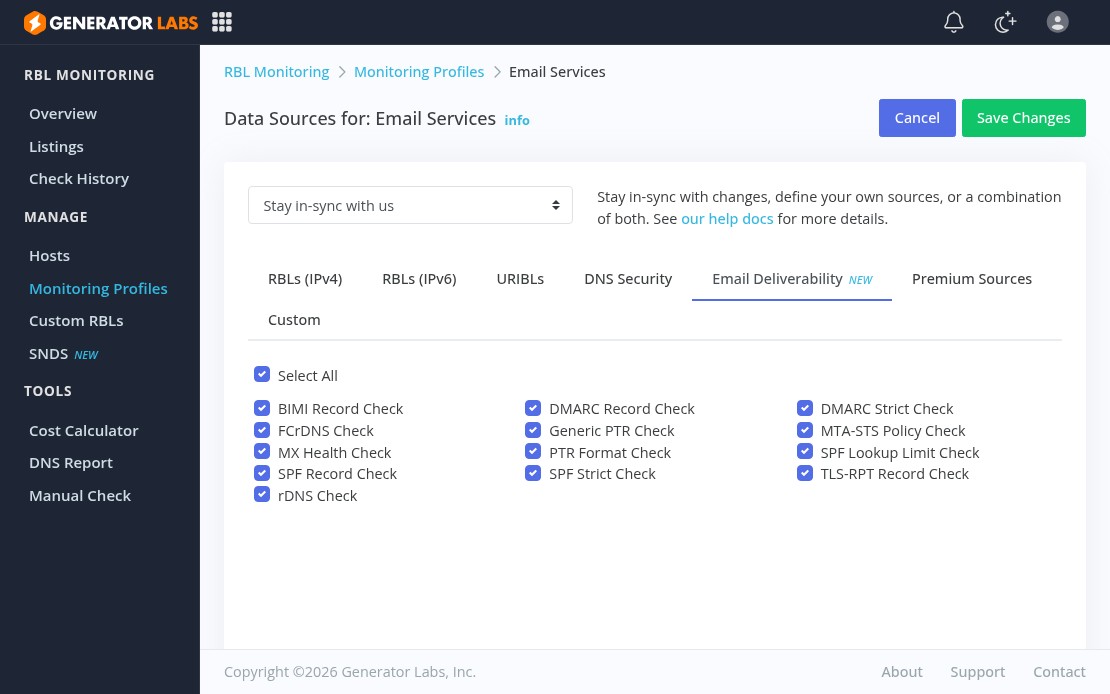
Getting listed on an RBL is one way mail stops delivering. There’s a longer list of DNS misconfigurations that cause mail to land in spam or get silently rejected, and most monitoring tools don’t catch them. Generator Labs has added 13 email deliverability checks directly into blacklist monitoring profiles, running alongside your RBL checks and feeding into the same alert pipeline.
All 13 checks are opt-in. Go to RBL Monitoring > Monitoring Profiles > Data Sources, click the Email Deliverability tab, and enable the ones you want. None of them run unless you explicitly turn them on.
The recommended approach is a dedicated profile for your mail-sending hosts so deliverability alerts don’t mix with RBL alerts from non-mail infrastructure. Failures trigger the same notifications and webhooks as blacklist listings, so they drop straight into your existing incident workflow.
Generator Labs provides infrastructure monitoring for teams that need to stay ahead of two specific problems: IP and domain blacklistings that kill email deliverability, and SSL certificates that expire without warning. Both products run in the same portal, so you manage everything in one place.
Blacklist Monitoring
Blacklist monitoring runs continuous checks of your IPv4 addresses, IPv6 addresses, and domains against hundreds of RBL and URIBL data sources. The moment a listing is detected, alerts go out through whatever channels you have configured: email, SMS, Slack, Discord, PagerDuty, or webhooks.
Coverage is the differentiator. Free one-shot tools check a handful of the major lists. Generator Labs checks well over a hundred data sources on a schedule, including 30+ premium sources on Enterprise and Ultimate plans that free tools do not cover. You get notified when something changes; you are not logging in to run a manual check.
Other features worth knowing:
Full IPv6 support. IPv4 and IPv6 addresses are both monitored across all plans. As more mail infrastructure goes dual-stack, IPv6 blacklisting is a real and growing issue that most monitoring tools still treat as secondary.
Shareable public reports. Every monitored host gets a public report URL you can hand to a client, ISP, or manager without giving anyone portal access.
REST API. Full programmatic access to monitoring data and controls, with client libraries for PHP, Node.js, and Python.
Blacklist Monitoring Pricing
Free: 1 host, 48-hour check interval, 100+ data sources. Free forever, no credit card required.
Professional: $8/month for 20 hosts at 24-hour intervals.
Enterprise: $16/month for 50 hosts at 12-hour intervals, premium data sources, custom run times.
Ultimate: $0.005 per check, unlimited hosts, custom intervals, all premium sources.
The Ultimate pay-per-check plan scales cleanly for larger deployments. Running 50 hosts daily against 150 data sources works out to roughly $11/month.
Certificate Monitoring
Certificate monitoring tracks SSL/TLS certificate expirations across your domains and sends alerts before anything expires. Add your domains, set alert thresholds, and the service runs automatically from there.
Both publicly-trusted and private or internal CA certificates are supported, which matters for teams running internal infrastructure that does not go through a public CA. Certificate expiry causes outages that are entirely preventable; automated monitoring removes the spreadsheet tracking and calendar reminders that most teams fall back on.
Monitoring profiles let you define reusable alert configurations across multiple monitors. Set custom expiration alert windows (5, 15, 30, 60 days, or any combination you need), choose which failure types trigger alerts, and assign private CAs or internal monitoring agents. One profile can cover dozens of monitors.
Certificate Monitoring Pricing
Certificate monitoring is priced at $0.01 per host per day, with no fixed tiers. You pay for what you monitor and can add or remove domains at any time.
Who It Is For
Email service providers and hosting companies monitoring large IP ranges
IT and security teams who need immediate notification when a host gets listed
Organizations managing many domains who need certificate expiry visibility without manual tracking
Developers who want API access to monitoring data for automation or integration