PgBouncer is the standard answer when an application opens more PostgreSQL connections than the server can usefully service. A process-per-request runtime and a serverless function that dials the database directly get there by completely different routes and land in the same place. The part that goes wrong is the pool mode, because the aggressive setting is the one everybody wants and it silently changes the semantics your code was written against.
Three Modes, One Real Decision
Session pooling assigns a server connection for the life of the client connection. It is safe and it buys you very little, since a worker process holding a connection for the length of a request is the situation you were trying to fix.
Transaction pooling assigns a server connection for the length of a transaction and returns it to the pool at commit. This is the mode that delivers the numbers people install PgBouncer for, and it is the mode with consequences.
Statement pooling returns the connection after every individual statement, which forbids multi-statement transactions entirely. It exists for specific workloads and is almost never what you want.
What Transaction Mode Takes Away
The rule is that anything living outside a transaction stops being reliable, because between two statements you may be on a different backend. That is a longer list than it first appears:
SET / RESET at session scope
LISTEN / NOTIFY
advisory locks taken outside a transaction
WITH HOLD cursors
temporary tables
session-scoped GUCs set by a connection hook
Session-level SET is the one that catches real applications. A framework bootstrap that sets search_path or timezone once on connect works perfectly in development against a direct connection, and in production the setting lands on whichever backend happened to serve that statement. Every later query gets a different backend without it. The failure is intermittent and nearly impossible to reproduce on demand.
Advisory locks are worse, because the failure is silent rather than noisy. A lock taken with pg_advisory_lock() outside a transaction belongs to a session you no longer control. The transaction-scoped variant, pg_advisory_xact_lock(), is released at commit and behaves correctly under transaction pooling. If you use advisory locks for job coordination, that one function name is the difference between working and quietly running the same job twice.
Prepared Statements Are Fixed, with Conditions
For years the answer to prepared statements under transaction pooling was that you could not use them. PgBouncer 1.21, released in October 2023, changed that. Set max_prepared_statements to a non-zero value and PgBouncer tracks named prepared statements itself, rewriting them to internal names and re-preparing them on whichever backend a client lands on:
The value is the size of an LRU cache of statements kept on each server connection, so it wants to be at least as large as the number of distinct statements a typical request issues. Zero disables the feature and restores the old behavior.
The condition attached is important. This only works for protocol-level prepared statements, the ones sent through the extended query protocol. A literal PREPARE foo AS SELECT ... sent as a plain text query is invisible to PgBouncer and still breaks, because from the outside it is just another statement.
For PHP specifically, this means checking what PDO is actually doing. With ATTR_EMULATE_PREPARES left on, PDO interpolates parameters client-side and sends plain SQL, so there are no real prepared statements and nothing to break. Turn emulation off and you get genuine protocol-level prepares, which is what you want for both correctness and plan reuse, and which is exactly the case max_prepared_statements exists to handle.
Start with transaction mode, then go looking for the session state your application depends on rather than waiting for it to surface. Grep for LISTEN, for pg_advisory_lock, for temporary tables, and for anything setting a GUC on connect. Move search_path out of a connection hook and into the connection string, where PgBouncer passes it through as part of the startup parameters and it survives correctly.
Keep a second pool in session mode on a different port for the small number of things that genuinely need a stable session, which is usually a migration runner and whatever handles LISTEN. Two pools with clear rules beats one pool with exceptions nobody remembers.
And size the pool against what PostgreSQL can actually do, since the point of pooling is to keep the database out of the region where it spends more time context switching than working. A pool larger than the database can service just moves the queue.
SMTP encryption is opportunistic by default, which means it is optional, which means it is strippable. A sending server connects, looks for STARTTLS in the EHLO response, and upgrades if it sees it. Remove that one line in transit and the sender falls back to plaintext without complaint, because it has no way to know TLS was ever supposed to happen. MTA-STS is how you tell it.
Why STARTTLS Alone Is Not Enough
The gap is that opportunistic TLS has no expectation to violate. A sender that fails to negotiate TLS has no basis to refuse delivery, since plenty of legitimate mail servers still do not offer it. Certificate validation is usually skipped for the same reason: a mail server presenting a self-signed or expired certificate is common enough that treating it as fatal would break real delivery.
So the default posture is an encrypted channel to an unverified party, downgradeable by anyone in the path. MTA-STS, specified in RFC 8461, lets a receiving domain publish a policy saying TLS is required, the certificate must validate, and here are the hostnames allowed to receive mail. Senders that implement it will refuse to deliver rather than fall back.
The Three Pieces
First, a DNS TXT record at the _mta-sts label telling senders a policy exists:
_mta-sts.example.com. IN TXT "v=STSv1; id=20260916120000Z;"
The id is the whole mechanism for cache invalidation. Senders compare it against the one they saw last time, and they only re-fetch the policy when it changes. Bump it on every policy edit or your change will not be noticed until caches expire on their own.
Second, the policy itself, served over HTTPS from a specific host and path:
mode takes enforce, testing, or none. Every MX that can receive mail for the domain needs a line, and a wildcard like *.example.com matches only the leftmost label, so it covers mail.example.com and not foo.bar.example.com. max_age is in seconds with a ceiling of 31557600, about a year.
Third, and this is the part people trip over: the mta-sts host serving that file needs a valid, publicly trusted certificate of its own. The policy is only as trustworthy as the HTTPS connection that delivered it, so a sender that cannot validate that certificate discards the policy entirely. You have now made your mail delivery depend on a certificate on a host that has nothing else to do with mail, which is exactly the kind of endpoint that quietly expires.
Start in Testing Mode
Publishing mode: enforce as the first step is how you find out about your forgotten backup MX by having mail to it rejected. mode: testing makes senders evaluate the policy, report failures, and deliver anyway.
Leave it there long enough to see a full cycle of your real traffic. A week is reasonable, longer if you have partners who send in bursts. The reports are the point of the exercise, which brings up the other half.
TLS-RPT Tells You What Broke
RFC 8460 defines a companion record that asks senders to report what happened. It is cheap to add and it is the only feedback channel you get:
_smtp._tls.example.com. IN TXT "v=TLSRPTv1; rua=mailto:tlsrpt@example.com"
Reports arrive as JSON, daily, from each sending organization that implements it. The useful part is the failure detail:
The result-type values are specific enough to act on directly. starttls-not-supported, certificate-expired, certificate-host-mismatch, certificate-not-trusted, validation-failure, and on the policy side sts-policy-fetch-error, sts-policy-invalid, and sts-webpki-invalid. That last group points at your policy host rather than your mail servers, which is a distinction worth internalizing before you start debugging the wrong machine.
The Ways This Bites
Caching cuts both ways. Once a sender has your policy with a week-long max_age, a mistake persists for that long even after you fix the file, unless the sender happens to re-check the id. Adding an MX means updating the policy and bumping the id before the new host starts receiving, and doing it in that order.
The certificate on the mta-sts web host is the failure nobody plans for. It is usually a static file on a server that gets less attention than the mail infrastructure, and when it expires, compliant senders stop trusting your policy. Whether that means mail is deferred or the policy is simply ignored depends on the sender.
Your MX certificates now genuinely have to be correct as well. Names have to match what the policy lists, chains have to be complete, and expiry stops being cosmetic. That is the point of turning it on, and it is worth knowing before you flip to enforce.
To check what you have published, the MTA-STS checker on mrdns.com fetches the record and the policy together and tells you whether they agree. For the mail server configuration underneath it, goodtls.com has per-application guides covering Postfix, Exim, Dovecot, and the rest.
Most systems I have worked on end up with a handful of tables that only ever grow. Event history, audit trails, request logs, anything append-only. None of them are interesting individually, and together they eventually dominate the maintenance budget: vacuum takes longer every month, index rebuilds turn into scheduled events, and a query that only wants last week has to reason about years of rows to prove it.
Declarative partitioning is the fix, and PostgreSQL has been good at it since 12. The parts worth writing down are how to get an existing table into it without downtime, and how to stop hand-managing it afterwards.
Partition on the Column You Actually Filter
Range partitioning by time is the obvious choice for append-only data, and the partition key has to appear in your WHERE clauses or you gain nothing. Partition by occurred_at while every query filters on account_id and each one still touches every partition.
CREATE TABLE events (
    id bigint GENERATED ALWAYS AS IDENTITY,
    account_id integer NOT NULL,
    occurred_at timestamptz NOT NULL,
    event_type smallint NOT NULL,
    PRIMARY KEY (id, occurred_at)
) PARTITION BY RANGE (occurred_at);
Note the primary key. Every unique constraint on a partitioned table has to include the partition key, so a plain PRIMARY KEY (id) is off the table. If another table carries a foreign key pointing at that id, you have a migration problem to solve before you start, and it is much better to find that now.
Migrating Without Downtime
The approach that works is to leave the existing table alone and attach it as a partition, which turns a rewrite into a metadata change:
ALTER TABLE events_old
    ADD CONSTRAINT events_old_range
    CHECK (occurred_at >= '2020-01-01' AND occurred_at < '2026-08-01') NOT VALID;

ALTER TABLE events_old VALIDATE CONSTRAINT events_old_range;

ALTER TABLE events ATTACH PARTITION events_old
    FOR VALUES FROM ('2020-01-01') TO ('2026-08-01');
The two-step constraint is the whole trick. Adding it NOT VALID takes a brief lock and skips the scan. VALIDATE CONSTRAINT then does the scan under a weaker lock that readers and writers work around. By the time ATTACH PARTITION runs, Postgres already knows every row satisfies the bound and skips the verification scan that would otherwise hold ACCESS EXCLUSIVE for the length of a full sequential read. Skip the constraint and the attach does that scan itself, with the table locked.
Detaching Beats Deleting
This is the payoff that justifies the whole exercise, and it is easy to undersell. Aging out old data from a monolithic table means DELETE, and a DELETE of ten million rows does not free anything. It writes ten million dead tuples, generates WAL for every one, leaves the indexes bloated, and hands autovacuum a large cleanup job that competes with your live traffic. The table on disk stays exactly as large as it was.
With partitions, the same operation is a catalog change:
ALTER TABLE events DETACH PARTITION events_2025_07 CONCURRENTLY;
No row is touched. No WAL is generated for the data. Nothing needs vacuuming afterwards. The CONCURRENTLY form avoids blocking readers while it happens, and the detached table is now an ordinary standalone table you can archive, dump somewhere cheap, or drop outright. That last distinction matters more than it sounds: detaching is reversible and gives you a table you can still query, while DELETE is a one-way trip that costs far more to perform.
Let pg_partman Run It
Something has to create next month's partition before next month arrives, and the failure mode of forgetting is an insert erroring out at midnight on the first. Hand-rolled cron jobs work until the person who wrote them moves on. pg_partman is the right answer here, and it handles both ends: creating partitions ahead of time and retiring old ones on a policy.
Note that pg_partman 5 changed this signature from the 4.x examples still floating around, and p_type now takes range or list rather than the old native. The p_premake value is how many partitions to keep created ahead, so four months of runway on a monthly interval.
Retention is a column in the extension's own config table:
UPDATE partman.part_config
SET retention              = '12 months',
    retention_keep_table   = true
WHERE parent_table = 'public.events';
The default for retention_keep_table is true, which detaches expired partitions and leaves them as standalone tables rather than dropping them. That default is the right one, and it is the same argument as above: you get the space accounting and the maintenance relief immediately, and the data is still sitting there if somebody asks for it next week. Set it to false only when you are certain, or leave it true and have a separate job that dumps and drops detached tables on its own schedule.
Maintenance runs either from the bundled background worker, by adding pg_partman_bgw to shared_preload_libraries, or from a scheduled call:
CALL partman.run_maintenance_proc();
Confirm Pruning Actually Happens
Partitioning silently does nothing if the planner cannot prune, so check rather than assume:
EXPLAIN (ANALYZE, BUFFERS)
SELECT count(*) FROM events
WHERE account_id = 4211
  AND occurred_at >= now() - interval '30 days';
You want a small number of partitions in the plan, and ideally Subplans Removed when the bound is only known at execution time. The thing that bites people is a partition key wrapped in a function or compared against a different type, which defeats pruning with no warning at all. A timestamptz column compared against a timestamp literal is the classic version.
What It Costs
Partition count matters. Planning time grows with the number of partitions, and daily partitions across five years is 1,800 relations the planner considers before it prunes anything. Monthly is usually right for history, weekly if the volume genuinely warrants it. Start coarse, since merging later is harder than splitting.
The payoff is that maintenance becomes proportional to the working set instead of the archive. Vacuum runs against the current partition. The old ones sit frozen and untouched until the day they get detached, which costs nothing.
Over the last while I have moved everything I run on AWS to Graviton, the ARM CPUs AWS designs in house: the EC2 instances behind my services and the ECS containers that make up most of the actual workload. The short version is that it was worth it, the bill went down, and almost nothing about how I write or run code had to change. The longer version has a few sharp edges worth writing down, plus some genuinely interesting silicon arriving now in Graviton5.
Why ARM in the Cloud
The pitch is not “ARM is faster,” it is price/performance. For the same dollar you generally get more useful work out of a Graviton instance than the equivalent Intel or AMD one, and AWS prices the instances lower on top of that. Set expectations correctly, though: a single Graviton core will not smoke a top-bin x86 core on a single-threaded benchmark. The win shows up across a fleet of web servers, API workers, queue consumers, and databases: more cores per dollar and steady throughput under real concurrent load. If you are chasing the lowest latency on one hot thread, measure first.
ARM vs Intel vs AMD in Practice
Graviton is my default: best price/performance for general compute, web tiers, microservices, and most databases, at the lowest cost and power.
AMD is the value x86 option when something genuinely needs x86 but not Intel specifically.
Intel is a deliberate choice for AVX-512, Intel-specific acceleration, or vendors that only certify on Intel. It is the priciest of the three.
What actually decides it is rarely the chip and almost always the software. If everything you run is open source or built from your own source, ARM is a non issue. The moment a proprietary, x86 only binary shows up, that workload stays on x86 until the vendor ships an ARM build. So the real question per service is not “is ARM fast enough,” it is “does every binary in this container have an arm64 version.”
What Actually Bit Me
None of these were dealbreakers, but I wish I had batched them up front instead of finding them one service at a time.
The first one is the biggest mindset shift: your images must be multi-arch. Your base images, every layer, and your own build all need linux/arm64. I moved to docker buildx and publish multi-arch manifests so one tag resolves correctly wherever it runs:
Then ECS has to be told which architecture to use. The task definition’s runtimePlatform defaults to x86, so set it to ARM64 and run on Graviton capacity or Fargate:
When a service misbehaves after the switch, the first thing I check is whether the published tag actually contains both architectures. This one-liner saves a lot of guessing:
docker buildx imagetools inspect myrepo/myservice:latest
# look for linux/amd64 and linux/arm64 in the platform list
The rest are smaller traps worth knowing up front:
Emulated CI is slow. Building arm64 on an x86 runner means QEMU, which is painful for anything compiled. You no longer have to: GitHub-hosted native arm64 runners are generally available, free for public repositories and now offered for private ones too, so the pipeline builds on real ARM hardware instead of emulating it.
Native dependencies are the long tail. Interpreted code moves for free; compiled extensions (native npm modules, Python wheels, cgo, old vendored binaries) each need an arm64 build.
Check your sidecars. Logging, metrics, and security agents need arm64 images too. The mainstream ones have them, but a sidecar that silently fails to start will ruin your afternoon.
Managed services are the easy win. RDS, ElastiCache, and Lambda offer Graviton with no code change. Start there to build confidence.
Graviton5: What Changed
While I was mid migration, AWS moved the goalposts. The lineage shows the trajectory:
Gen
Cores
Microarch
ISA
Clock
Memory
Graviton2
64
Neoverse N1
Armv8.2-A
2.5 GHz
DDR4
Graviton3
64
Neoverse V1
Armv8.4-A
2.6 GHz
DDR5-4800
Graviton4
96
Neoverse V2
Armv9.0-A
2.8 GHz
DDR5-5600
Graviton5
192
Neoverse V3
Armv9.2-A
3.3 GHz
DDR5-8800
Graviton5, announced in December 2025 with M9g instances reaching general availability in mid 2026, is a bigger step than the version bump suggests. It doubles Graviton4 to 192 Neoverse V3 cores, built on a 3nm process as four chiplets of 48 cores each with up to ~420 GB/s between chiplets. It carries 192 MB of L3 cache (around five times the prior generation), 2 MB of L2 per core, DDR5-8800, and PCIe Gen6. It also ships a new Nitro Isolation Engine, which AWS describes as a formally verified hypervisor: the VM isolation property is mathematically proven, not just tested.
AWS quotes roughly 25% better compute than Graviton4 per core, with up to ~35% on web apps, up to ~35% on ML inference, and ~30% on databases from improved branch prediction. Take vendor percentages with the usual grain of salt and benchmark your own workload, but the architecture behind them is real. For densely packed container fleets the per core number matters less than doubling the cores while growing cache and memory bandwidth. The general purpose M9g and M9gd are out now; the compute optimized C9g and memory optimized R9g are the variants I am waiting on, since most of my fleet maps to those shapes.
Is It Worth It
For me, clearly yes. If your stack is containers and managed services built from source or mainstream images, the migration is mostly mechanical: make images multi-arch, set the architecture on your tasks, fix the native dependency stragglers. Start with managed services for an easy win, then move containers one service at a time so you can roll back cleanly. The one piece of advice I would give my past self: audit dependencies and sidecars for arm64 support before flipping anything. Ninety percent of the work is trivial. The other ten percent is one unmaintained binary you forgot about, and it is much nicer to find it on a spreadsheet than in a failing deployment.
I’ve spent a lot of time in my career building and scaling out APIs, and over the years I’ve noticed something: most of what makes an API scale is not what people write about. The standard advice stops at “put a load balancer in front and add more web servers.” That is the easy part. The web tier is stateless, so you can buy your way out of it. The interesting problems sit behind it, in the database, the cache, and the way clients talk to you.
So I wrote down the less-obvious things, the decisions that decide whether an API absorbs a traffic spike or falls over at the first one. None of it is exotic. It is just the stuff that tends to get learned the hard way.
Put Rate Limiting at the Front Door
Rate limiting is almost always an afterthought. The API works, traffic is light, and capping requests feels like next quarter’s problem. Then one bad client or a runaway retry loop sends ten thousand requests a minute and takes the whole service down. It belongs at the very front, not the end: a request you reject at the edge costs nothing, no query, no cache lookup, no compute. Use a token bucket keyed per client, which absorbs short bursts and settles to a steady rate:
# token bucket, one per client, refilled at a steady rate
b = buckets[client_id]
b.refill(rate = 100/min)
if b.tokens < 1 {
    return 429, ratelimit_headers(b)   # reject at the edge, cheaply
}
b.tokens -= 1
What people skip is telling the client what the limits are. A bare 429 leaves every client guessing, and a guessing client retries badly. The IETF is standardizing this in RateLimit header fields for HTTP, replacing the dozen proprietary X-RateLimit-* variants with one standard set:
HTTP/1.1 429 Too Many Requests
RateLimit-Limit: 100
RateLimit-Remaining: 0
RateLimit-Reset: 42
Retry-After: 42
It also defines a combined RateLimit field and a RateLimit-Policy that advertises the quota up front. The draft comes from the Italian government, Red Hat, and Microsoft rather than a single vendor, and providers like Cloudflare already emit these. Send them, and well-behaved clients throttle themselves, which is load you never have to shed by force.
Retries Are the Other Half of Rate Limiting
Rate limiting controls what comes in. Retries are what happens when you say no, and they can hurt more than the original traffic. The classic failure: you get slow, clients time out, every client retries at once, and that traffic lands on a system already underwater. It is called a retry storm, and it is one of the most common ways an API takes itself down.
Retries need exponential backoff with jitter. Backoff makes each attempt wait longer than the last; jitter adds randomness so a thousand clients that failed at the same instant do not all retry at the same instant and collide again on the next wave. AWS has a good write-up on why jitter matters. Cap the attempts as well, so a failing dependency is not hammered forever:
for attempt in 0..maxRetries {
    resp = send(request)
    if resp.ok or not retryable(resp) {
        return resp
    }
    delay = min(cap, base * 2**attempt)
    sleep(random(0, delay))            # full jitter desynchronizes clients
}
return last_error                      # give up; do not retry past the budget
The other question is whether a retry is even safe. A retried write must not charge a card or create a record twice. Idempotency keys solve this: the client sends a unique key, you store the result against it, and a repeat of that key returns the stored result instead of redoing the work.
POST /v1/charges
Idempotency-Key: 8f14e45f-ceea-467a-9f1a-1b2c3d4e5f60

# server side: claim the key atomically BEFORE doing any work
key = request.header["Idempotency-Key"]
if not store.claim(key) {              # insert-if-absent; false if it already exists
    return store.await_result(key)     # another copy owns it: wait for or replay its result
}
resp = process(request)
store.put(key, resp, ttl=24h)          # record the result for future replays
return resp
The claim has to be atomic. A plain check-then-write lets two concurrent retries both miss and both run, which defeats the whole point; an insert guarded by a unique constraint, or a Redis SETNX, makes exactly one caller the owner; the rest wait for or replay its result. Stripe wrote the canonical description. Build it in early, because retrofitting idempotency onto live write endpoints is painful.
Caching Is a Stack, Not a Setting
Everyone caches. What gets missed is that caching happens at several independent layers, and the biggest win is often the one you ignored:
HTTP caching via Cache-Control, so browsers and intermediaries reuse a response without asking again.
CDN or edge caching, serving one response to many clients from a nearby location.
Application caching in memory or Redis, for computed values and query results.
Database caching, the query-plan and buffer caches the database keeps on its own.
The application layer usually follows the cache-aside pattern: check the cache, fall back to the source on a miss, then populate it for next time. Store a sentinel for empty results too, or a lookup that finds nothing falls through to the database on every call.
# cache-aside: nil means a real miss, not a cached "not found"
v = cache.get(key)
if v == nil {
    v = db.query(key)
    cache.set(key, v ?? NEGATIVE, ttl = 10s)   # cache empties too, as a sentinel
}
return (v == NEGATIVE) ? null : v
The lesson that changed how I think about caching is that even a tiny TTL pays off. You do not need an hour. On an endpoint hit a hundred times a second, a ten-second cache means you compute the real answer once and serve it from cache about a thousand times:
The data is ten seconds stale, which nobody notices on most read paths, and you have cut the load behind the cache by three orders of magnitude. Short TTLs are the cheapest scaling lever there is, and they get left on the table because ten seconds feels too short to bother with. The stale-while-revalidate hint, from RFC 5861, goes further still: a cache serves the stale copy instantly while it refreshes in the background, so no client ever waits on the miss.
Not Every Response Needs a Body
If a client already holds a copy that has not changed, the cheapest possible response is to say exactly that. You attach an ETag, a short version fingerprint, to the response; the client sends it back on its next request, and if nothing changed you return a 304 with no body:
GET /v1/widgets/42
If-None-Match: "a1b2c3d4"

HTTP/1.1 304 Not Modified
MDN has the details. That saves bandwidth, and often computation too: if you can decide the ETag is unchanged without building the full response, you skip the expensive work entirely.
Stampedes Bypass Your Cache
This is the one that bites people, because it defeats the cache you just built, and the reason is hiding in that cache-aside snippet: the cache is only written at the end, after the query returns. That is fine until traffic is concurrent.
Picture a popular key with a ten-second TTL. It expires, and in the window between the first request missing and that same request finishing its query, every other request that arrives also finds the cache empty, also misses, and also queries the database, because nobody has populated it yet. Under load that window holds hundreds of requests, and they all run the same query at once. The cache that was meant to protect the database has aimed a thundering herd straight at it. In the logs it looks like this:
12:00:09.998  hit   key=widgets:top
12:00:10.001  MISS  key=widgets:top  -> db query 1422ms
12:00:10.001  MISS  key=widgets:top  -> db query 1455ms
12:00:10.002  MISS  key=widgets:top  -> db query 1480ms
12:00:10.002  MISS  key=widgets:top  -> db query 1503ms
   ... 900 more identical queries in the same 4ms ...
The more popular the key, the bigger the herd, so a stampede hits your hottest paths hardest. Wikipedia calls it a cache stampede. The fix is single-flight, or request coalescing: when many callers need the same uncached value, one does the work and the rest wait and share its result. Go ships it as golang.org/x/sync/singleflight:
v, _, _ := g.Do("widgets:top", func() (any, error) {
    return loadFromDB()      // runs once; the herd shares its result
})
One query runs instead of a thousand. But single-flight only coalesces within one process. Across a fleet of servers each one still rebuilds the key once, so a popular key gives you one stampede per server. To collapse the rebuild across the whole fleet, take a short distributed lock in Redis with SET NX and let the single winner rebuild while everyone else serves the previous value:
# only ONE caller across the fleet rebuilds the key
ok = redis.set("lock:" + key, token, NX=true, EX=5)
if ok {                                # we won the lock
    v = loadFromDB()
    cache.set(key, v, ttl=10s)
    redis.del("lock:" + key)           # release (verify token first in real code)
} else {                               # someone else is already rebuilding
    v = cache.get_stale(key)           # serve the slightly-stale copy, do not pile on
}
SET key value NX means set the key only if it does not already exist. It is atomic, so it succeeds for exactly one caller and fails for every other, which is precisely the property a lock needs. The EX 5 gives the lock a five-second expiry, so a holder that crashes mid-rebuild cannot wedge the key shut forever. The winner does the one rebuild; everyone else sees the lock is taken and serves the old value instead of hammering the database. Single-flight handles the in-process herd, the Redis lock handles the cross-fleet herd, and they compose.
Two cheaper measures help on top: jitter your TTLs so keys created together do not all expire together, and use probabilistic early expiration so a hot key refreshes just before it goes cold. Behind a CDN the same idea is origin shield or tiered caching, collapsing many edge misses into a single origin request; CloudFront calls it Origin Shield. Turn it on.
Send Reads to Read Replicas
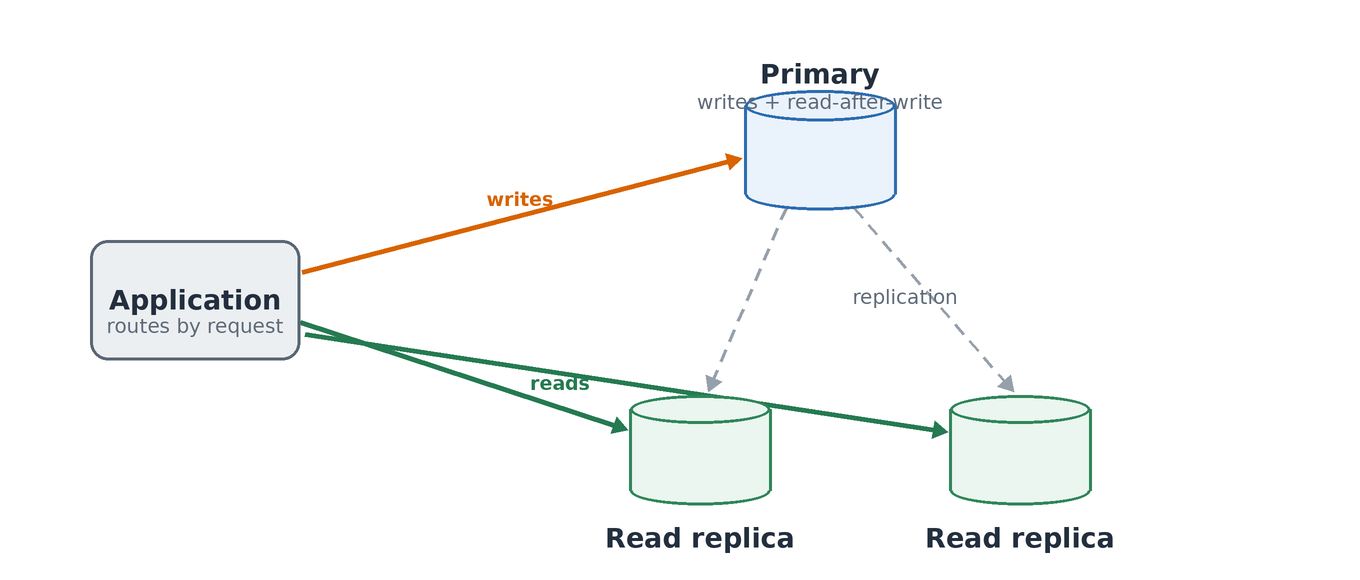
Most APIs are read-heavy, and mine is no exception: reads dwarf writes. Yet by default they all go to the same primary that handles writes, and that primary becomes your bottleneck long before anything else does. Split them: the primary takes writes, one or more replicas take reads, and you route each request to the right place:
func dbFor(req) Conn {
    if req.Method != "GET" {
        return primary              // all writes go to the primary
    }
    if req.Path == "/v1/orders/checkout" {
        return primary              // read-after-write must be current
    }
    return replicas.next()          // round-robin across read replicas
}
The catch is replication lag. A replica trails the primary by a fraction of a second, so a client that writes and immediately reads its own write can see stale data. Route those read-after-write paths to the primary, as the checkout case does, and send everything else to the replicas.
Writes go to the primary; reads fan out to the replicas. Read-after-write paths stay on the primary, because replication lags by a fraction of a second.
Connection Pooling Is the Hidden Ceiling
Read replicas lead straight to the least glamorous and most important item here. A database connection is not free. On most engines each one is a server-side process or thread with real memory behind it, and there is a hard limit on how many can exist at once. If every worker opens its own, you hit that ceiling long before you run out of CPU or memory, and the database refuses new connections while your servers sit mostly idle.
The fix is a connection pooler between the application and the database, multiplexing many client connections onto a few real ones. Every engine has the option: PgBouncer or pgpool for Postgres, ProxySQL for MySQL, an in-process pool in most drivers and ORMs. PgBouncer makes a good example, because the detail that matters is its pooling mode:
In transaction mode a client holds a real connection only for the length of a single transaction, so the twenty above can serve a thousand clients. The mode is the whole game: session pooling pins a connection to a client for its entire session and scales far worse. The one catch is that anything relying on session state, like prepared statements or advisory locks, needs care or a different mode.
Pooling and the read/write split from the last section are separate jobs, but they meet here: you usually run one pool per endpoint, one against the primary and one against the replicas, and the application picks the pool the same way the router earlier picked the database. Some proxies will do that routing for you. ProxySQL and pgpool-II can inspect a query and send writes to the primary and reads to a replica, and RDS Proxy offers read-only endpoints for Aurora. It is convenient, but I keep the routing in the application, because a proxy guessing read versus write still has to get transactions and read-after-write right, and that is exactly where it tends to surprise you.
This gets dramatically worse with serverless, a perfect segue to the next section. If every function instance opens its own connection, a spike that starts hundreds of instances opens hundreds of connections at once, and the database refuses them. On AWS the managed answer is RDS Proxy. Whatever the engine, the rule is the same: the connection count is a hard ceiling, and pooling is how you raise it.
The OFFSET Pagination Cliff
This one stays invisible until your tables get big. LIMIT/OFFSET pagination works perfectly in testing, but OFFSET does not skip rows for free: to reach the rows after an offset, the database has to generate every row before it and throw them away. The first page is instant. By the five-thousandth, it is walking past a hundred thousand rows and discarding them on every request, and it only gets slower the deeper anyone pages. Use keyset, or cursor, pagination instead: remember the sort key of the last row you returned and ask for the rows after it:
select id, name from widgets
where id > :last_id
order by id
limit 20;
With an index on the sort column, every page costs the same at any depth. It also stays correct when rows are inserted mid-page, where OFFSET silently skips or duplicates. The one thing you give up is jumping to an arbitrary page number, which most APIs do not actually need.
One catch: the sort key has to be unique. If you page by something that is not, like a timestamp, order by a unique tiebreaker as well, such as (created_at, id), and compare the pair; otherwise two rows that share a value can straddle a page boundary and get skipped or repeated.
Watch for Hot Keys
Even with replicas and caching, a single key can be popular enough that the one node holding it becomes a bottleneck while everything else sits idle: a celebrity account, a viral item, one enormous customer. Horizontal scaling does not help, because you cannot shard a single key across machines. Cache that value locally in each process so it never touches the shared store, or, for a write hot spot, add a small random suffix to the key so the load spreads across nodes:
# pin a hot value in-process so it never hits the shared store
if local.fresh(key) {
    return local.get(key)              # zero network, zero shared load
}
v = redis.get(key)
local.set(key, v, ttl = 1s)            # a one-second local cache is enough
return v
The trap is that average load can look perfectly healthy while one key is on fire, so watch your hottest keys specifically, not just the average.
Move Work to Write-Time
The cheapest request is one whose answer was computed before it arrived. A surprising amount of read load is the same aggregation or join, recomputed on every call, when it could have been computed once, when the data changed, and simply read back. This is the same instinct as caching, moved one step earlier: do the work on the write, not on the read.
The bluntest form is a denormalized counter or rollup maintained on write. Instead of a count(*) across a large table on every read, keep the number in a column and update it in the same transaction as the write:
-- on write: keep the rollup current
update widgets set view_count = view_count + 1 where id = :id;

-- on read: no aggregation, just a column
select view_count from widgets where id = :id;
For heavier aggregates, a materialized view precomputes the result and stores it, so the read is a plain select against an indexed table instead of a large scan. You refresh it on a schedule or when the inputs change:
create materialized view top_widgets as
    select widget_id, count(*) as hits
    from views
    group by widget_id;

refresh materialized view concurrently top_widgets;   -- on a schedule
The fullest form is a precomputed read model: when a write lands, assemble the exact shape the read endpoint serves and store it, so the endpoint becomes a key lookup rather than a query. The tradeoff is real, though. You do more work on writes, the read can lag the truth by a little, and you now have a thing to keep in sync. For a read-heavy API that is almost always the right trade, because writes are rare and reads are constant, so you are moving work off the path that runs a thousand times as often.
Do Not Let One Slow Dependency Sink Everything
Scaling is also about failing well. When one dependency slows down, the default is for requests to pile up waiting on it, each holding a thread and a connection, until the whole service is exhausted and even unrelated endpoints stop responding. One slow thing takes down everything. Three patterns prevent it: load shedding, rejecting some requests when you are over capacity, because a fast 503 beats a slow timeout; circuit breakers, which stop calling a clearly-failing dependency and fail fast; and bulkheads, which isolate the connection or thread pool per dependency so one cannot starve the others. Load shedding can be as blunt as a concurrency cap at the front of the handler:
# a bounded semaphore acquires-or-fails atomically: no check-then-act race
if not slots.try_acquire() {        # slots = maxInflight permits
    w.Header().Set("Retry-After", "1")
    return 503, "over capacity"     // shed early, protect the rest
}
defer slots.release()
A circuit breaker applies the same idea to a downstream dependency: once it is clearly failing, stop calling it and return right away instead of making every request wait out the timeout. The piece people forget is the way back: after a cooldown the breaker goes half-open and lets a single probe through, which closes it on success or re-opens it on failure. Without that, it stays open forever.
if breaker.state == OPEN {
    if not breaker.cooldown_elapsed() {
        return fallback()              # fail fast while the breaker is open
    }
    breaker.state = HALF_OPEN          # cooldown passed: let one probe through
}
resp, err = call(dependency)
breaker.record(err)                    # a clean probe closes it; a failure re-opens
return resp
And a lot of work does not belong in the request at all. If a client asks for something slow, accept it, return 202 Accepted with a URL to poll, and hand the work to a queue that background workers drain at their own pace:
HTTP/1.1 202 Accepted
Location: /v1/jobs/abc123
That keeps the request path fast and lets the slow work scale independently of the API that accepts it.
Scaling With Managed Pieces
You do not have to build all of this yourself. On AWS, API Gateway and Lambda bundle a lot of it together, and the pair is worth understanding even if you never deploy on it, because it is a good illustration of what sensible defaults look like.
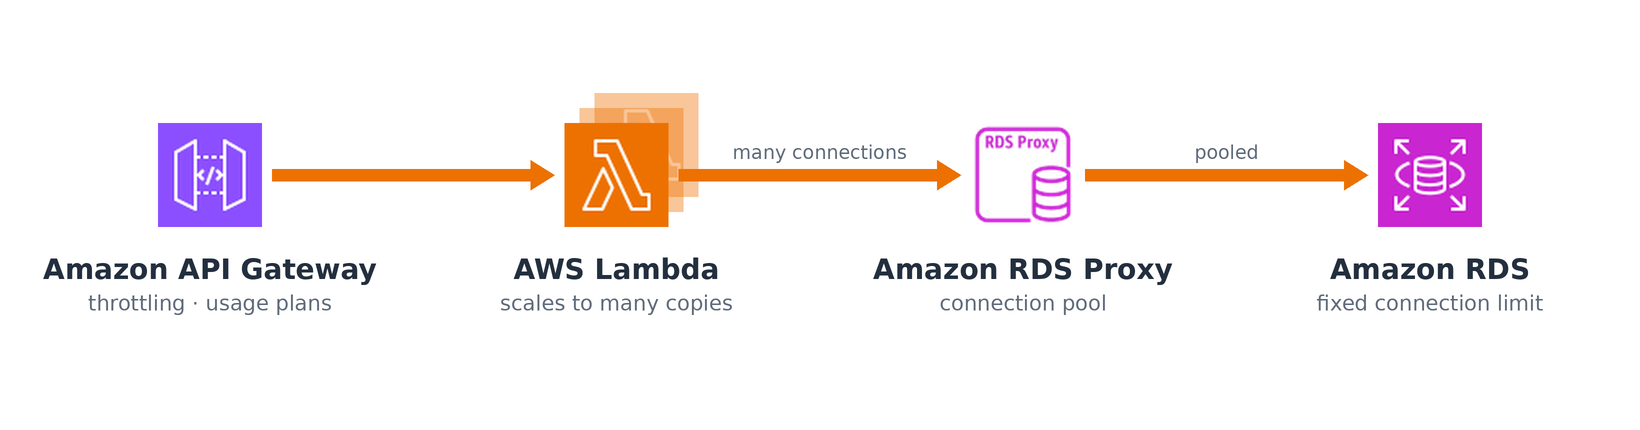
API Gateway throttles at the edge, Lambda scales to many copies, and RDS Proxy pools their connections down to a set the database can actually handle.
API Gateway sits in front as the door. It gives you throttling, per-client usage plans, response caching, and request validation at the edge, before a bad request ever reaches your code. A usage plan is the same token bucket from the first section, plus a burst ceiling and a monthly quota, attached to an API key and handed to you as configuration instead of code you write and maintain. Behind it, Lambda runs your handler and scales the compute automatically, spinning up copies to match concurrency, with provisioned concurrency to keep a pool warm if cold starts hurt.
The trap is the one from the last section: Lambda scales by running many isolated copies of your function, and if each copy opens its own database connection, a spike turns into a connection storm, which is exactly why RDS Proxy exists. But that connection problem hints at a larger truth: not every API belongs in Lambda in the first place.
Lambda is a great fit when traffic is spiky or has a low baseline, the kind of workload where you would otherwise pay for servers that sit idle most of the time. A webhook receiver that fires a few times a minute, a payment or Slack callback, an internal endpoint hit occasionally, a scheduled job, a public API whose traffic swings between near-zero and sudden bursts: in all of those you pay only for what actually runs, and the automatic scaling does precisely what you want.
It is a poor fit in a few specific cases, and they are worth knowing before you commit to it:
Sustained high throughput. At a steady few thousand requests a second, per-invocation pricing costs far more than a couple of always-on containers, and you get none of the idle-time savings that justify Lambda in the first place. A busy search or feed API is cheaper and more predictable running on containers.
Tight latency budgets. A cold start adds tens to hundreds of milliseconds. If your p99 target is 50ms, a cold start blows straight through it, and buying enough provisioned concurrency to avoid that is just paying for warm servers with extra steps.
Long-running or streaming requests. API Gateway caps a synchronous integration at 29 seconds, with no exceptions. A long report, a large file download, a slow upstream call, or a server-sent-events stream simply does not fit. That work belongs on a normal server, or behind the 202-and-a-queue pattern from earlier.
Heavy shared state. Each invocation is isolated, so the in-process hot-key cache from earlier does not survive between requests, and anything that wants a large warm local cache or a long-lived connection fights the execution model the whole way.
The rule I actually use: reach for Lambda when traffic is bursty and the work is short and self-contained, and reach for plain containers behind a load balancer when traffic is steady, latency-sensitive, or long-running. The underlying pattern outlives the vendor either way. Elastic compute in front of a database with a fixed connection limit needs a pooler between the two, or it will scale right past what the database can take.
The Thread Running Through All of It
If there is one idea connecting all of this, it is that scaling an API is mostly about not doing work. Cache the answer so you do not compute it twice. Coalesce duplicate requests so one query serves a thousand callers. Send reads to replicas so the primary is free for writes. Shed or defer the load you cannot handle right now. Reject early what you were going to reject anyway. Adding servers is the part everyone talks about, because it is the part you can buy. These are the things that decide whether those servers spend their time on real work, or on work you could have avoided.